Analytics audit and gap analysis
We review your current tracking setup — GA4, Search Console, UTM hygiene, CRM attribution — and produce a written gap analysis showing exactly what data you're missing and why it matters.

Performance Analytics
We build analytics dashboards that track content performance by business outcome — traffic, leads, and pipeline contribution — so you know what to make more of and what to cut.
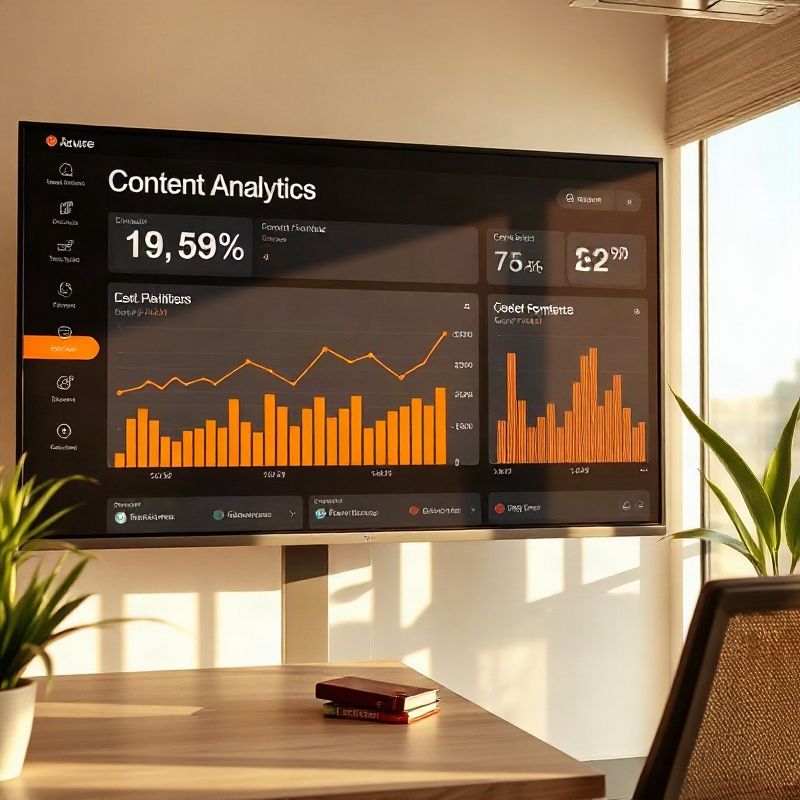
Most content teams can tell you how many articles they published last quarter. Few can tell you which three generated 80% of the leads, which format drove the most newsletter sign-ups, or why organic traffic dropped in March. Stonezpanda builds analytics infrastructure that answers those questions reliably. We connect your CMS, Google Analytics or Plausible, your CRM, and your email platform into a unified dashboard — segmented by content type, topic pillar, funnel stage, and distribution channel. Every metric on the dashboard is tied to a business question your team actually cares about, and we document the interpretation guide so you're never left wondering what a number means.
We review your current tracking setup — GA4, Search Console, UTM hygiene, CRM attribution — and produce a written gap analysis showing exactly what data you're missing and why it matters.
A live dashboard — built in Looker Studio, Notion, or your preferred BI tool — that pulls content performance data into one view, segmented by pillar, format, and funnel stage.
We configure UTM parameters and CRM pipeline tagging so you can trace leads and revenue back to the specific content piece and channel that generated first or last touch — not just the campaign.
A written guide — one page per dashboard section — that explains what each metric means, what a healthy range looks like for your content volume, and what action to take when a metric moves outside that range.
Analytics dashboards reveal patterns and correlations — they don't prove causation. A spike in organic traffic after publishing a pillar article may coincide with a broader SEO trend rather than the article itself. We document these caveats in the interpretation guide and build in a 60-day review session where we walk through your first real data set together and calibrate the benchmarks. We configure up to four data source integrations per engagement; additional sources are quoted separately. We do not manage ongoing reporting, monthly slide decks, or data interpretation retainers under this service — those are available under a separate analytics operations package.
Let's set up the dashboards that tell you what's working — and why — within four weeks.
Start the conversation